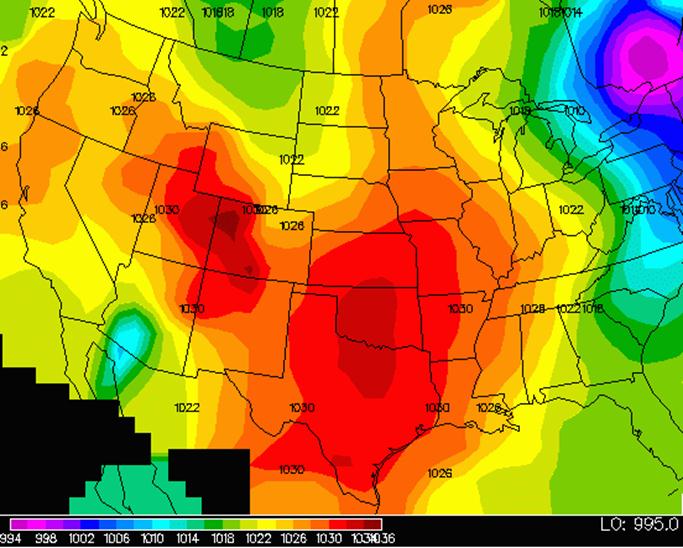
- In
the figure is shown a contour map of atmospheric pressure over the United States.
Basic meteorology says that winds will flow from areas of high pressure
to low pressure, in the direction of the pressure gradient. Assuming the
resistance to air flow is constant anywhere in the country, determine
the areas where wind speeds will be the greatest, and in what direction.
(Note -- this is only a very basic estimate. The ground and the rotation
of the earth both influence the flow of the wind).
|
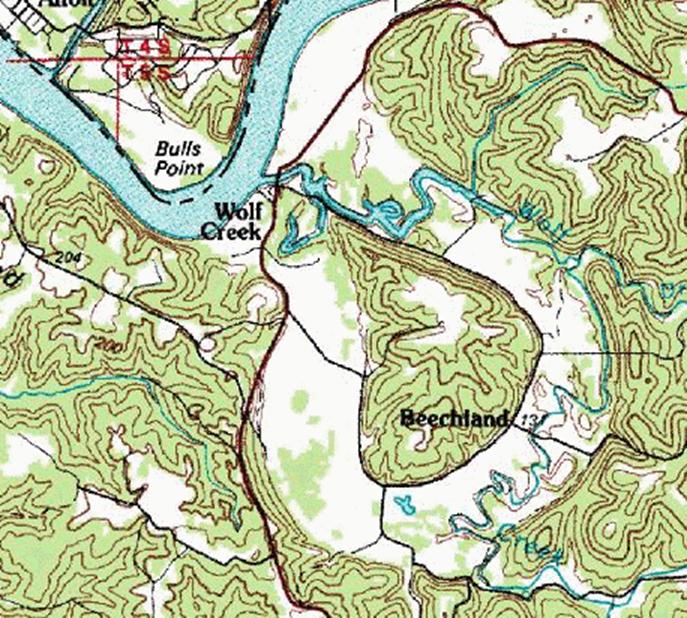
- In
the figure is shown a contour map of an unusual feature in Meade County near the Ohio
River. Show the directions rain runoff flows in this area.
|
- Consider the following potential:
Use the following JAVA programs
to plot a surface plot of U(x,y), to plots the
equipotential surfaces of U(x,y), and to plot
the E-field in the chip.
 Surface
Plotter for this problem Surface
Plotter for this problem
Equipotential
Surfaces Plotter for this problem
NOTE – if these JAVA programs
will not run, you can use this FLASH program
(click
here) but it is a little more complicated. There is a button for toggling between
surface (3d grapher) and equipotent (contour)
plots. Set xmin,
ymin, and zmin to
-10, and xmax, ymax,
and zmax to +10. Also, you can use Wolfram Alpha (click here) and tell it to “plot
<insert equation here> for -10<x<10, -10<y<10” but its
free capabilities are limited.
Vector
Field Plotter for this problem (I
have found no alternative to this JAVA program)
Note – in these programs the equation to be plotted must be entered in
usual “computer notation”. This
means multiplication is *, division is /, and powers are ^. So
U(x,y) = 2x2 + 4y/x3
Would mean the following is entered in the box that days “PLOT” or “U(x,y)”:
(2*x^2)+(4*y/(x^3))
|
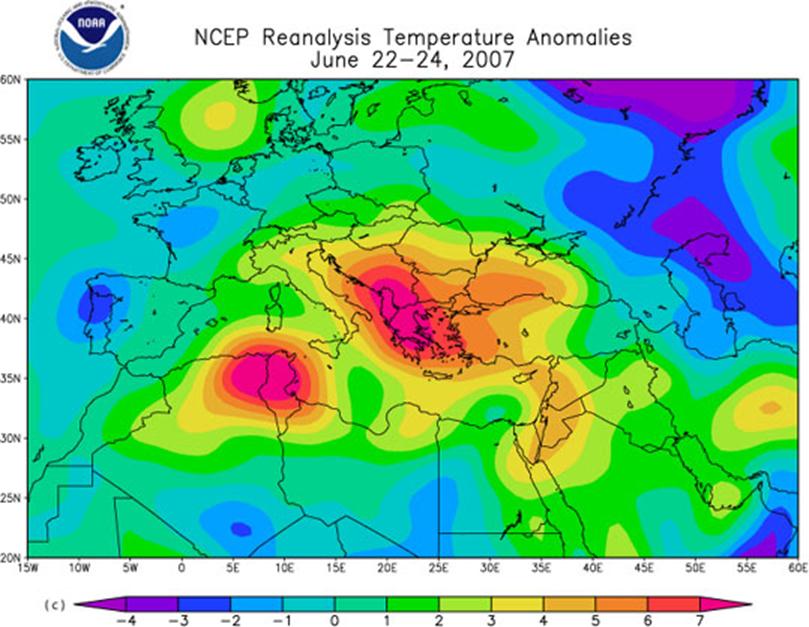
- In
the figure below, determine where what areas show the highest temperatures,
what areas show the lowest temperatures, and what areas show the
steepest temperature gradients.
|
- Consider
the equation

a) Make an x-y graph of this equation.
The limits of the axes should be 0<x<4 and 0<y<1.
b) Now imagine this curve is rotated around the y axis, so that it makes
a “hill”. Draw this “hill” as
seen from the side, showing equipotential surfaces (contour lines). Then draw this “hill” as seen from
above, showing equipotential surfaces (contour lines).
|